Prices rose: compare them with the rest of the city
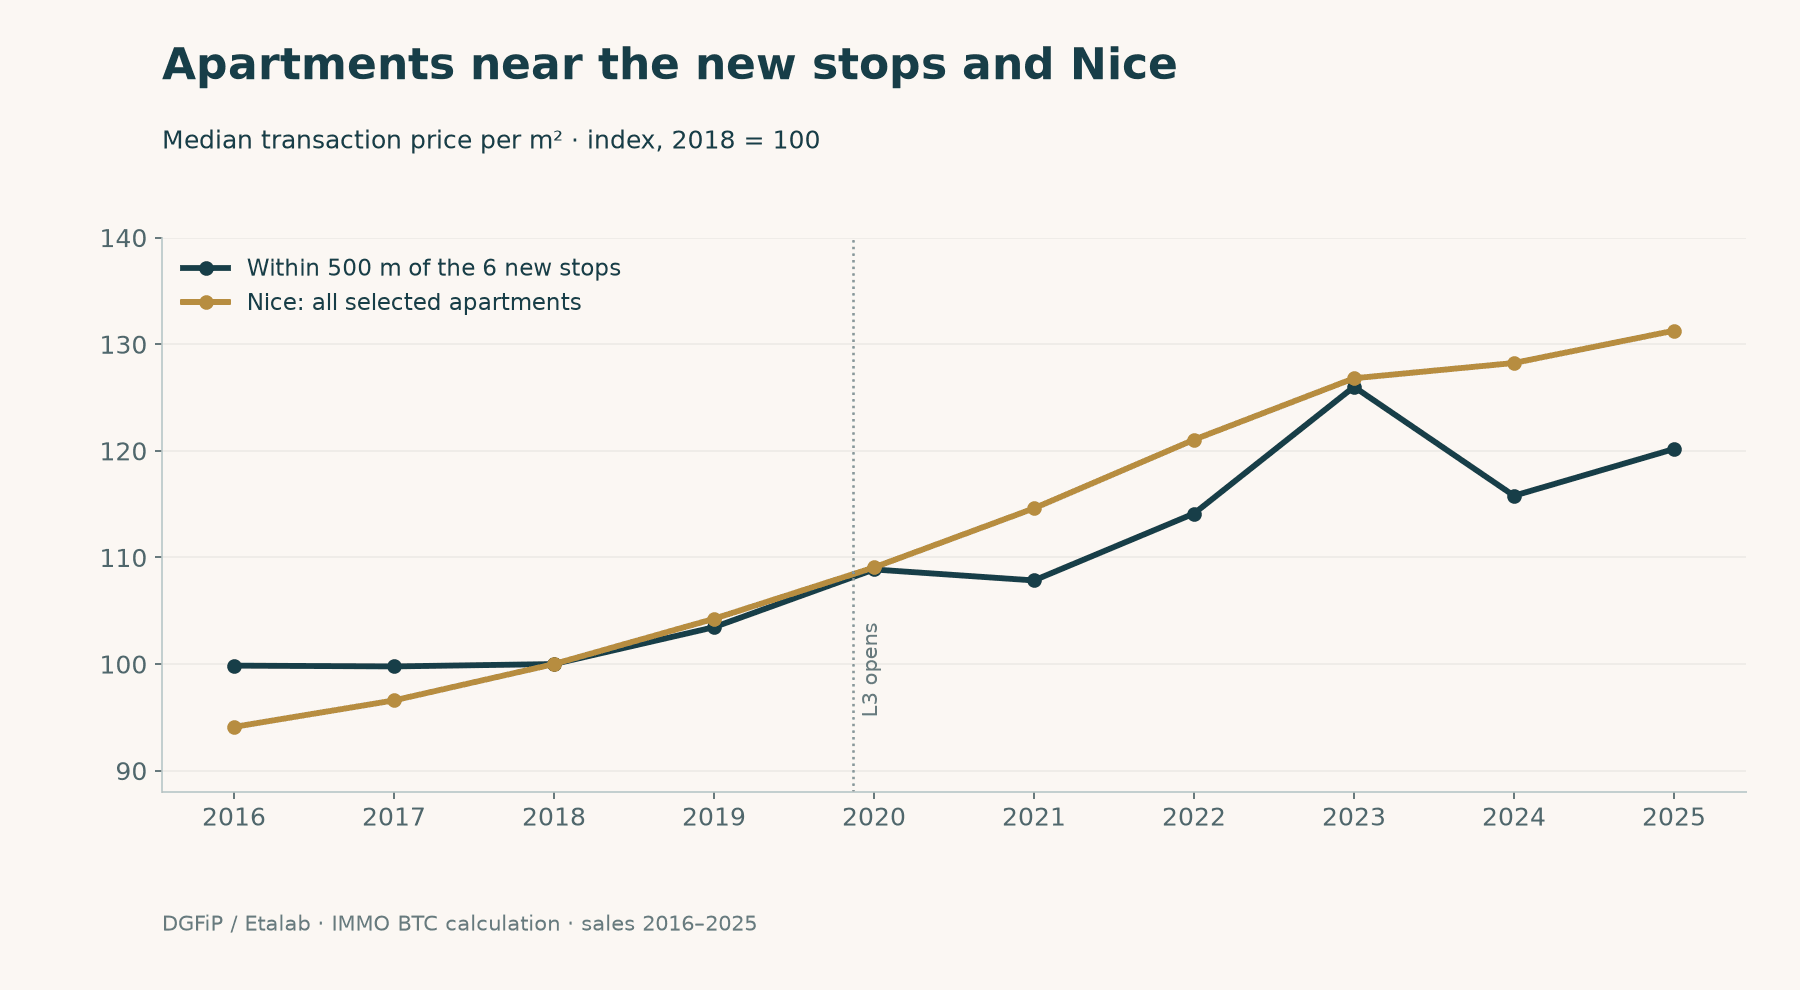
Near the six new stops on the western section, the median registered apartment sale price rose from €4,080/m² in 2018 to €4,903/m² in 2025, or about 20.2%. Across selected sales throughout Nice, the increase was about 31.3%, from €3,697 to €4,853/m².
The mix of apartments sold also changes: smaller homes one year, larger or differently located homes another. We therefore ran a second calculation accounting for floor area, room count and location. It estimates a −2.4% relative difference against the rest of Nice over 2018–2025, with substantial statistical uncertainty.
What this means for a buyer: our data do not support the promise that an apartment near the tram will gain value faster. If a seller asks more specifically because the stop is nearby, ask for the prices at which similar apartments nearby have actually sold. Then consider how much time that route saves on your everyday journeys. This helps you identify the convenience you are paying extra for and check whether actual sales support the asking price.
How to read the chart at the top
The dark line represents apartments within 500 m of the six new stops; the gold line represents all selected apartments across Nice. Each group’s own 2018 price is set to 100. A reading of 120 therefore means a 20% increase since 2018. The lines meet at 100 because we chose that reference point; their actual prices were different.
By 2025, the dark line reaches about 120, compared with 131 for the gold line. Over the full period, the median near the stops therefore rose more slowly than the citywide median. The dark line moves above the gold line in 2023, then falls below it in 2024. This shows why drawing a conclusion from one strong year can be misleading. The dotted line marks L3’s opening in November 2019.
Different apartments sell each year. To understand how much floor area and location contribute to the gap, we account for those differences in a second calculation below.
Which section actually opened
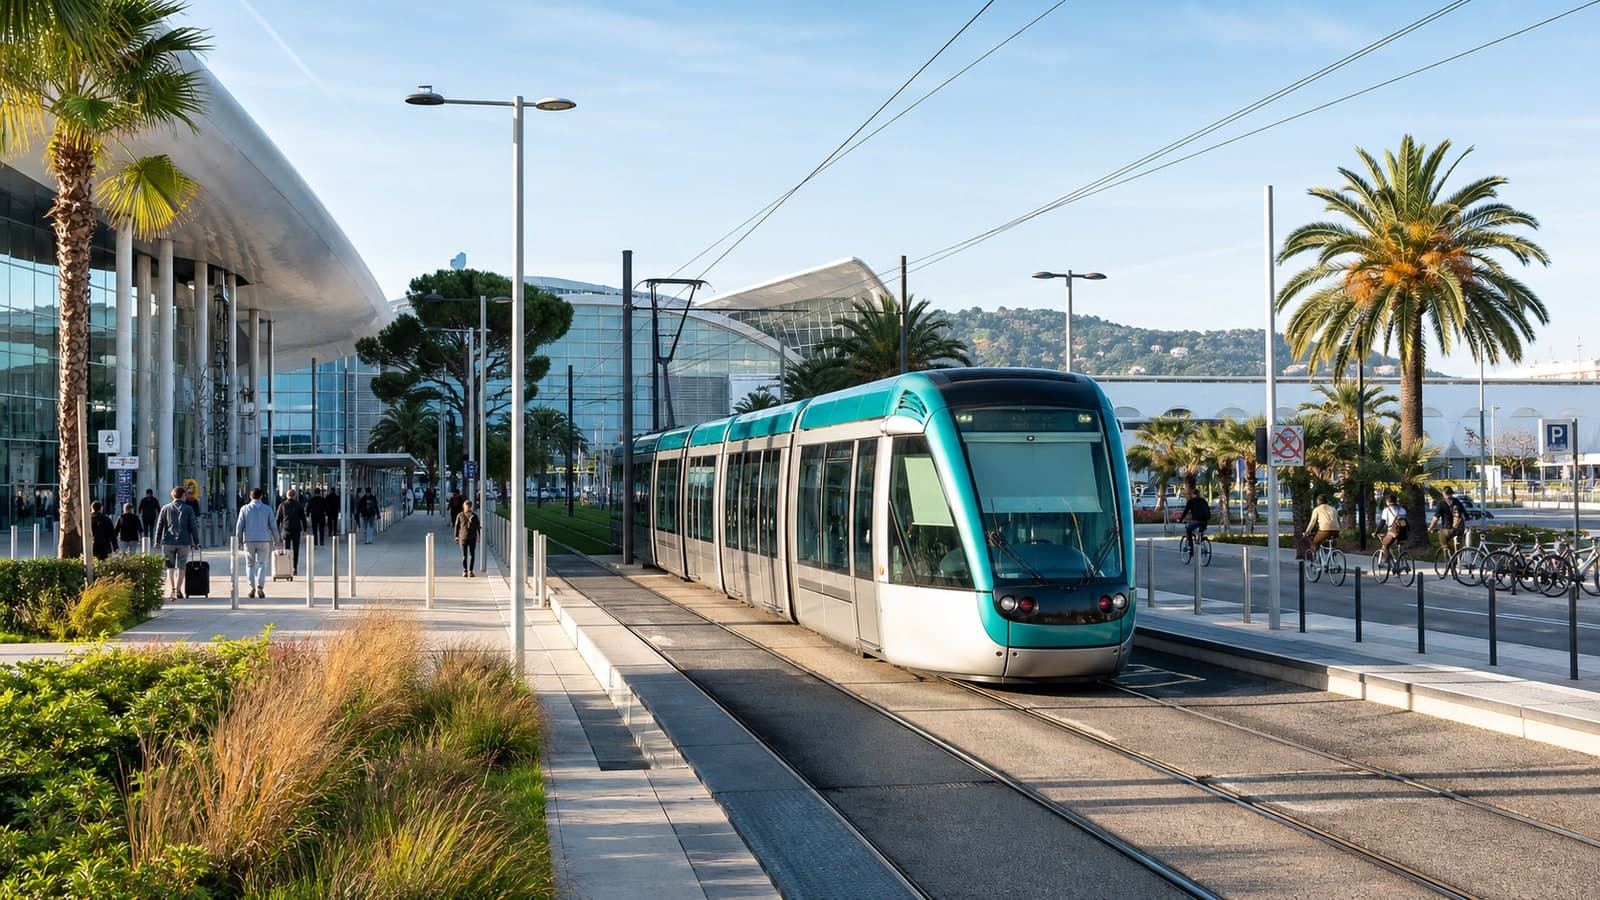
L3 opened on 13 November 2019, connecting the airport and Saint-Isidore via Grand Arénas, Méridia and the Allianz Riviera stadium. The opened section ends at Saint-Isidore; Lingostière is outside this sample.
The airport branch has a different timeline: the first western L2 section opened on 30 June 2018, the airport branch in December 2018 and the full L2 line on 14 December 2019. To study L3’s opening, we therefore selected the six new stops north of Digue des Français, from Méridia to Saint-Isidore. The section shared with the earlier line near the airport is excluded from this group.
The network has since changed: in the timetable effective from 31 August 2026, L3 connects Port Lympia and Saint-Isidore. Check the current network map for the journey to a terminal. The future Nice-Aéroport railway hub works are a separate project.
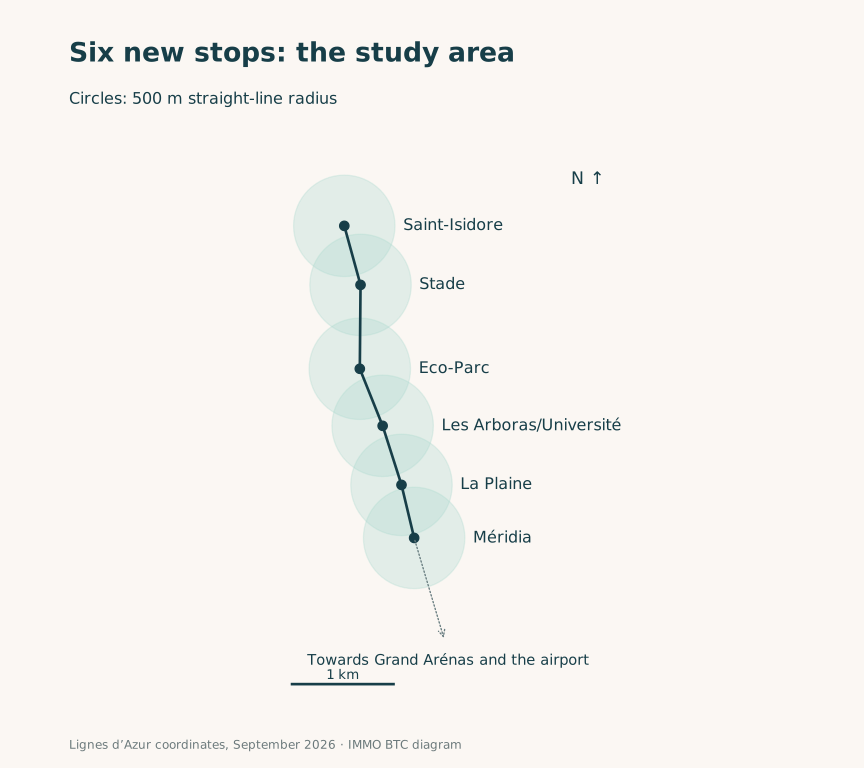
Coordinates: Lignes d’Azur open data, September 2026. Distances are measured in a straight line; walking routes may be longer.
What annual sales show
We selected ordinary sales of one apartment with a known price and floor area. The source is DGFiP / Etalab; for 2016–2020, we used an archived copy of the official April 2021 release. The last complete year studied is 2025.
| Year | Within 500 m of the new stops, €/m² | Sales in this group | Nice, €/m² |
|---|---|---|---|
| 2016 | 4,074 | 80 | 3,479 |
| 2017 | 4,071 | 84 | 3,571 |
| 2018 | 4,080 | 68 | 3,697 |
| 2019 | 4,221 | 100 | 3,854 |
| 2020 | 4,442 | 104 | 4,032 |
| 2021 | 4,400 | 133 | 4,237 |
| 2022 | 4,656 | 128 | 4,475 |
| 2023 | 5,141 | 97 | 4,688 |
| 2024 | 4,724 | 93 | 4,741 |
| 2025 | 4,903 | 127 | 4,853 |
Source: DGFiP / Etalab; IMMO BTC calculations. Each transaction’s total price is divided by the apartment’s floor area, then the median is calculated. Parking and other premises may be included in the price. The citywide group contains between 6,348 and 8,896 geolocated sales per year.
The median divides sales into two halves by price per m². It rose sharply near the stops in 2023, then fell in 2024. With a small local sample, these movements can reflect both prices and differences between the apartments sold.
Adjusting for the apartment mix
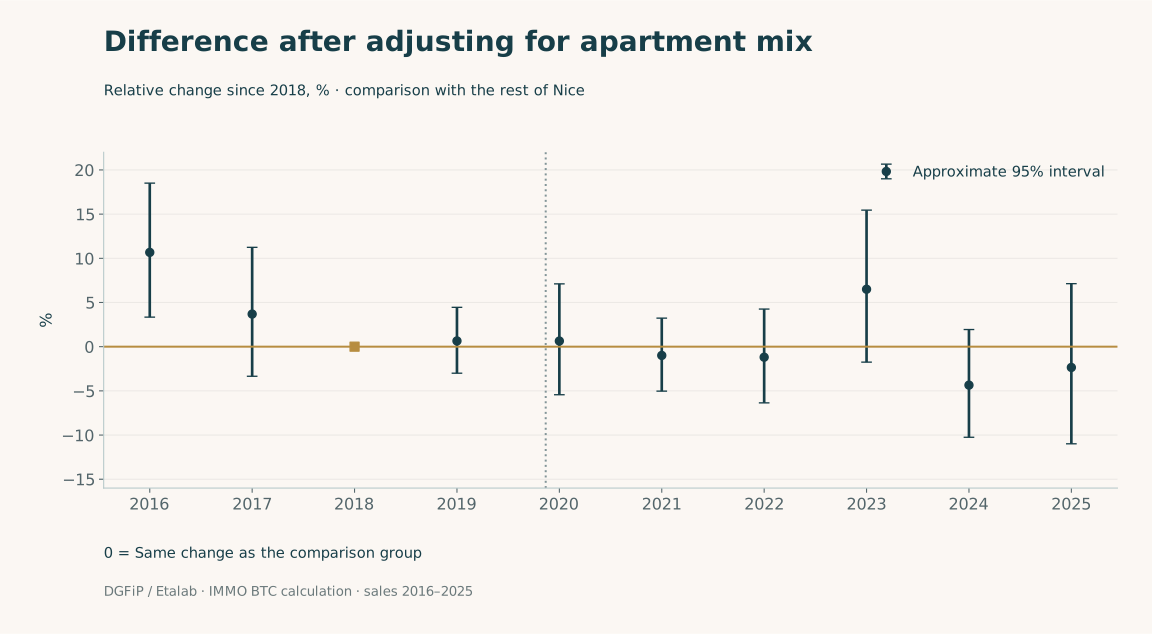
The second calculation compares the trend with apartments more than 1 km from the six stops. It accounts for floor area, room count and persistent differences between small areas of the city. It retains apartments of 15–200 m² with 1–6 rooms, in areas with sales before and after opening: 71,083 observations over ten years.
How to read the adjusted chart
- The dots show how price changes near the stops differ from changes more than 1 km away, after accounting for floor area, room count and location. Above zero means faster growth near the stops since 2018; below zero means slower growth.
- The gold line at zero means the same growth in both groups since 2018. This compares changes over time; the apartments themselves may have different prices.
- The vertical bars around the dots show uncertainty in the calculation: longer bars mean a less precise estimate. When a bar crosses zero, the data are also consistent with the same growth in both groups.
The 2025 dot is at −2.4%, indicating a small estimated shortfall near the stops. This is a relative difference in growth since 2018; prices themselves rose over that period. The approximate 95% interval runs from −11.0% to +7.1% and crosses zero. The data therefore cannot establish with sufficient confidence whether growth was slower or faster.
The main finding in this chart: the bars cross zero in every complete year after L3 opened. Once differences between apartments are taken into account, the results are consistent with similar growth in the other areas used for comparison. The study does not establish faster growth near the stops.
Restricting the comparison to neighbouring areas 1–2 km away changes the estimate to +3.4%, with an interval of −6.3% to +14.2%. At 400 m and 600 m radii, estimates against the city comparison group are −2.5% and −1.3%. These calculations do not establish a single stable premium to add to every apartment near the line.
What the study can explain
The nearby and comparison groups already followed different trends in 2016–2018, before opening. Housing, employment and other developments also changed the area; buyers could anticipate the tram’s arrival. The calculated difference therefore describes an observed trend under the chosen adjustments. The data did not allow us to isolate the tramway’s causal contribution reliably.
For a purchase, assess the practical benefit: time saved, the walk to the stop, noise, crossings and building access. Then compare the price with recent sales of similar nearby apartments. Our four-city DVF comparison provides an initial budget reference.
The detailed methodology and sensitivity checks explain the sample, model and sources. This is an informational market analysis; a particular home needs its own valuation.
Sources and verification date
Checked on 21 September 2026. Data periods are identified in the article.